This the multi-page printable view of this section. Click here to print.
Documentation
- 1: Internal Documentation
- 1.1: Tutorials
- 1.1.1: Adding ADO alerts
- 1.1.2: Run Hive Locally
- 1.2: Getting Access
- 1.2.1: Getting Backplane Access
- 1.2.2: Getting OCM API Access
- 1.3:
- 1.4: Feature Flags in ADO
- 1.5: Interrupt Catcher
- 1.6: Incident Management
- 1.7: On-Call
- 2: Onboarding
- 2.1: Introduction
- 2.2: ROMS
- 2.3: Acceptance Criteria Checklist
- 2.4: Pager Handover
- 2.5: Soak Test
- 3: Release Process
- 4: Addons Flow
- 4.1: Addons Flow Architecture
- 4.2: APIs
- 4.3: Metrics
- 5: Creating Addons
- 5.1: Monitoring Addons
- 5.1.1: SLO Dashboards
- 5.1.2: Dead Man's Snitch Operator Integration
- 5.1.3: PagerDuty Integration
- 5.1.4: OCM SendGrid Service Integration
- 5.2: Testing Addons
- 5.2.1: Installing a specific version of an Addon in a staging environment
- 5.2.2: Testing With OCP (Without OCM)
- 5.2.3: Testing With OSD-E2E
- 5.3: Top Level Operator
- 5.3.1: Customer Notifications
- 5.3.2: Dependencies
- 5.3.3: Environments
- 5.3.4: Plug and Play Addon
- 5.4: managed-tenants Repository
- 5.5: SKU
1 - Internal Documentation
1.1 - Tutorials
1.1.1 - Adding ADO alerts
This guide describes how to add alerts for addon-operator in the OSD RHOBS tenant.
Background
Since the addon-operator doesn’t have a specific tenant in RHOBS with a service account, the addon-operator metrics are scraped to the OSD tenant with its own service account, so instead of adding rules using obsctl cli and syncing them using obsctl-reloader SRE-P has a repo called rhobs-rules-and-dashboards which, based on the tenant, will automatically sync rules defined in the repo to app-interface.
Overview
We need to have the following prerequisites:
If the tenant is not defined in the repo, we need to follow the process defined here which explains how to register the tenant in app-interface and how to configure obsctl-reloader to sync rules for the particular tenant.
The OSD tenant is already registered and the obsctl-reloader configuration is already defined here (we should see osd in MANAGED_TENANTS parameter in the observatorium-mst-common named item and secrets are defined here)
Steps
we can define rules for the addon-operator metrics in the rhobs-rules-and-dashboards repo in the rules/osd folder (the tenants are added as individual folders) and tests for the prometheus rules are defined in the tests/rules/osd folder. The suggested file naming conventions are described here.
tldr: create file name with .prometheusrule.yaml as a suffix,
add tenant label to the PrometheusRule object.
Adding promrules
For creating a PoC alert we have selected the addon_operator_addon_health_info metric
since it basically explains the addon health for a particular version and cluster_id.
The metrics for creating alerts can be decided and the promql queries
can be tested out from promlens stage
or promlens prod.
The metrics are scraped from addon-operator to the
observatorium-mst-stage (stage) / observatorium-mst-prod (prod) datasources.
Sample addon_operator_addon_health_info metric data:
addon_operator_addon_health_info{_id="08d94ae0-a943-47ea-ac29-6cf65284aeba", container="metrics-relay-server", endpoint="https", instance="10.129.2.11:8443", job="addon-operator-metrics", name="managed-odh", namespace="openshift-addon-operator", pod="addon-operator-manager-7c9df45684-86mh4", prometheus="openshift-monitoring/k8s", receive="true", service="addon-operator-metrics", tenant_id="770c1124-6ae8-4324-a9d4-9ce08590094b", version="0.0.0"}
This particular metric gives information about
version, cluster_id (_id) and addon_name (name) which can be used to create the alert.
- We should ignore the metrics with version
"0.0.0" - The addon health is
"Unhealthy"if no version exists for the particular addon with value 1 - In theory, the latest version for the particular addon
should have the value of 1. If not, then the addon is
"Unhealthy"
The prometheus rule for the addon_operator_addon_health_info metric is defined here
expr: (count by (name, _id) (addon_operator_addon_health_info{version!="0.0.0"})) - (count by (name,_id) (addon_operator_addon_health_info{version!="0.0.0"} == 0)) == 0
Explanation:
We aggregate all metrics on name and _id and count the non-0 value metrics.
If the count is 0 (implying there has been no non-0 value metrics), raise the alert.
Writing tests for the promrules
First create a <alertname>.promrulestests.yaml file in the test/rules/"Unhealthy".
Try out different scenarios by defining different series as
input to the test rules such as here.
The tests can be validated by running: make test-rules
in the rhobs-rules-and-dashboards directory.
NOTE: Make sure that the tests are defined in the tests/rules/
Since the pagerduty config is defined on a per tenant basis which is osd tenant in this case,
the alert will be triggered and paged to SRE-P,
so a proper runbook should be added redirecting the alert to lp-sre folks.
The runbook links/ SOP links can be validated by running: make check-runbooks
1.1.2 - Run Hive Locally
This guide describes how to deploy a Hive environment in your local machine using kind.
For the managed clusters, this guide covers both kind clusters and CRC clusters.
Preparation
Setup your GOPATH. Add to your ~/.bashrc:
export GOPATH=$HOME/go
export PATH=${PATH}:${GOPATH}/bin
Install kind:
~$ curl -Lo ./kind https://kind.sigs.k8s.io/dl/v0.10.0/kind-linux-amd64
~$ chmod +x ./kind
~$ mv ./kind ~/.local/bin/kind
This guide was created using kind version:
kind v0.14.0 go1.18.2 linux/amd64
Install the dependencies:
~$ GO111MODULE=on go get sigs.k8s.io/kustomize/kustomize/v3
~$ go get github.com/cloudflare/cfssl/cmd/cfssl
~$ go get github.com/cloudflare/cfssl/cmd/cfssljson
~$ go get -u github.com/openshift/imagebuilder/cmd/imagebuilder
Clone OLM and checkout the version:
~$ git clone git@github.com:operator-framework/operator-lifecycle-manager.git
~$ cd operator-lifecycle-manager
~/operator-lifecycle-manager$ git checkout -b v0.21.2 v0.21.2
~/operator-lifecycle-manager$ cd ..
Clone Hive and checkout the version:
~$ git clone git@github.com:openshift/hive.git
~$ cd hive
~/hive$ git checkout 56adaaacf5f8075e3ad0896dac35243a863ec07b
Edit the hack/create-kind-cluster.sh, adding the apiServerAddress pointing
to your local docker0 bridge IP. This is needed so the Hive cluster, which
runs inside a docker container, can reach the managed cluster, running inside
another docker container:
kind: Cluster
apiVersion: kind.x-k8s.io/v1alpha4
networking:
  apiServerAddress: "172.17.0.1"  # docker0 bridge IP
containerdConfigPatches:
  - |-
    [plugins."io.containerd.grpc.v1.cri".registry.mirrors."localhost:${reg_port}"]
      endpoint = ["http://${reg_name}:${reg_port}"]
Hive
Export the Hive kubeconfig filename (it will be created later):
~$ export KUBECONFIG=/tmp/hive.conf
Enter the hive directory:
~$ cd hive
Create the Hive cluster:
~/hive$ ./hack/create-kind-cluster.sh hive
Creating cluster "hive" ...
Creating cluster "hive" ...
 ✓ Ensuring node image (kindest/node:v1.24.0) 🖼
 ✓ Preparing nodes 📦
 ✓ Writing configuration 📜
 ✓ Starting control-plane 🕹️
 ✓ Installing CNI 🔌
 ✓ Installing StorageClass 💾
Set kubectl context to "kind-hive"
You can now use your cluster with:

kubectl cluster-info --context kind-hive

Not sure what to do next? 😅  Check out https://kind.sigs.k8s.io/docs/user/quick-start/
The /tmp/hive.conf file is created now. Checking the installation:
~/hive$ docker ps
CONTAINER ID   IMAGE                  COMMAND                  CREATED         STATUS         PORTS                                       NAMES
901f215229a4   kindest/node:v1.24.0   "/usr/local/bin/entr…"   2 minutes ago   Up 2 minutes   172.17.0.1:41299->6443/tcp                  hive-control-plane
0d4bf61da0a3   registry:2             "/entrypoint.sh /etc…"   3 hours ago     Up 3 hours     0.0.0.0:5000->5000/tcp, :::5000->5000/tcp   kind-registry
~/hive$  kubectl cluster-info
Kubernetes control plane is running at https://172.17.0.1:41299
KubeDNS is running at https://172.17.0.1:41299/api/v1/namespaces/kube-system/services/kube-dns:dns/proxy

To further debug and diagnose cluster problems, use 'kubectl cluster-info dump'.
Build Hive and push the image to the local registry:
~/hive$ CGO_ENABLED=0 IMG=localhost:5000/hive:latest make docker-dev-push
Deploy Hive to the hive cluster:
~/hive$ IMG=localhost:5000/hive:latest make deploy
Because we are not running on OpenShift we must also create a secret with certificates for the hiveadmission webhooks:
~/hive$ ./hack/hiveadmission-dev-cert.sh
If the hive cluster is using node image kindest/node:v1.24.0 or later, you will
have to additionally run:
~/hive$ ./hack/create-service-account-secrets.sh
because starting in Kubernetes 1.24.0, secrets are no longer automatically generated for service accounts.
Tip: if it fails, check kubectl version. The Client and Server versions
should be in sync:
~/hive$ kubectl version --short
Client Version: v1.24.0
Kustomize Version: v4.5.4
Server Version: v1.24.0
Checking the Hive pods:
~/hive$ kubectl get pods -n hive
NAME                                READY   STATUS    RESTARTS   AGE
hive-clustersync-0                  1/1     Running   0          26m
hive-controllers-79bbbc7f98-q9pxm   1/1     Running   0          26m
hive-operator-69c4649b96-wmd79      1/1     Running   0          26m
hiveadmission-6697d9df99-jdl4l      1/1     Running   0          26m
hiveadmission-6697d9df99-s9pv9      1/1     Running   0          26m
Managed Cluster - Kind
Open a new terminal.
Export the Hive kubeconfig filename (it will be created later):
~$ export KUBECONFIG=/tmp/cluster1.conf
Enter the hive directory:
~$ cd hive
~/hive$
Create the managed cluster:
~/hive$ ./hack/create-kind-cluster.sh cluster1
Creating cluster "cluster1" ...
 ✓ Ensuring node image (kindest/node:v1.24.0) 🖼
 ✓ Preparing nodes 📦
 ✓ Writing configuration 📜
 ✓ Starting control-plane 🕹️
 ✓ Installing CNI 🔌
 ✓ Installing StorageClass 💾
Set kubectl context to "kind-cluster1"
You can now use your cluster with:

kubectl cluster-info --context kind-cluster1

Have a nice day! 👋
 😊
The /tmp/cluster1.conf file is created now. Checking the installation:
~/hive$ docker ps
CONTAINER ID   IMAGE                  COMMAND                  CREATED             STATUS             PORTS                                       NAMES
267fa20f4a0f   kindest/node:v1.24.0   "/usr/local/bin/entr…"   2 minutes ago       Up 2 minutes       172.17.0.1:40431->6443/tcp                  cluster1-control-plane
901f215229a4   kindest/node:v1.24.0   "/usr/local/bin/entr…"   About an hour ago   Up About an hour   172.17.0.1:41299->6443/tcp                  hive-control-plane
0d4bf61da0a3   registry:2             "/entrypoint.sh /etc…"   5 hours ago         Up 5 hours         0.0.0.0:5000->5000/tcp, :::5000->5000/tcp   kind-registry
~/hive$ kubectl cluster-info
Kubernetes control plane is running at https://172.17.0.1:40431
KubeDNS is running at https://172.17.0.1:40431/api/v1/namespaces/kube-system/services/kube-dns:dns/proxy

To further debug and diagnose cluster problems, use 'kubectl cluster-info dump'.
Before we install OLM, we have to edit the install scripts to use cluster1. Go into scripts/build_local.sh
and replace
  if [[ ${#CLUSTERS[@]} == 1 ]]; then
    KIND_FLAGS="--name ${CLUSTERS[0]}"
    echo 'Use cluster ${CLUSTERS[0]}'
  fi
with
KIND_FLAGS="--name cluster1"
Now enter the OLM directory:
~/hive$ cd ../operator-lifecycle-manager/
~/operator-lifecycle-manager$
Install the CRDs and OLM using:
~/operator-lifecycle-manager$ make run-local
OLM pods should be running now:
~/git/operator-lifecycle-manager$ kubectl get pods -n olm
NAME                                READY   STATUS    RESTARTS   AGE
catalog-operator-54bbdffc6b-hf8rz   1/1     Running   0          87s
olm-operator-6bfbd74fb8-cjl4b       1/1     Running   0          87s
operatorhubio-catalog-gdk2d         1/1     Running   0          48s
packageserver-5d67bbc56b-6vxqb      1/1     Running   0          46s
With the cluster1 installed, let’s create a ClusterDeployment in Hive
pointing to it.
Export the Hive kubeconfig filename and enter the hive directory (or just
switch to the first terminal, the one used to deploy Hive):
~$ export KUBECONFIG=/tmp/hive.conf
~$ cd hive
Attention: hiveutil wants you to have default credentials in ~/.aws/credentials You can fake them like this:
~/hive$ cat ~/.aws/credentials
[default]
aws_access_key_id = foo
aws_secret_access_key = bar
Because Hive will not provision that cluster, we have can use the hiveutil
to adopt the cluster:
~/hive$ bin/hiveutil create-cluster \
--base-domain=new-installer.openshift.com kind-cluster1  \
--adopt --adopt-admin-kubeconfig=/tmp/cluster1.conf \
--adopt-infra-id=fakeinfra \
--adopt-cluster-id=fakeid
Checking the ClusterDeployment:
~/hive$ kubectl get clusterdeployment
NAME            PLATFORM   REGION      CLUSTERTYPE   INSTALLED   INFRAID   VERSION   POWERSTATE   AGE
kind-cluster1   aws        us-east-1                 true        infra1                           48s
Checking the ClusterDeployment status:
~/hive$ kubectl get clusterdeployment kind-cluster1 -o json | jq .status.conditions
[
  ...
  {
    "lastProbeTime": "2021-02-01T14:02:42Z",
    "lastTransitionTime": "2021-02-01T14:02:42Z",
    "message": "SyncSet apply is successful",
    "reason": "SyncSetApplySuccess",
    "status": "False",
    "type": "SyncSetFailed"
  },
  {
    "lastProbeTime": "2021-02-01T14:02:41Z",
    "lastTransitionTime": "2021-02-01T14:02:41Z",
    "message": "cluster is reachable",
    "reason": "ClusterReachable",
    "status": "False",
    "type": "Unreachable"
  },
  ...
]
Managed Cluster - CRC
Export the CRC kubeconfig filename to be created:
~$ export KUBECONFIG=/tmp/crc.conf
Login to your CRC cluster with the kubeadmin user:
~$ oc login -u kubeadmin -p **** https://api.crc.testing:6443
The /tmp/crc.conf file should now contain the dockerconfig for your
CRC cluster.
Export the Hive kubeconfig filename and enter the hive directory (or just
switch to the first terminal, the one used to deploy Hive):
~$ export KUBECONFIG=/tmp/hive.conf
~$ cd hive
Because Hive will not provision that cluster, we have can use the hiveutil
to adopt it:
~/hive$ bin/hiveutil create-cluster \
--base-domain=crc.openshift.com crc  \
--adopt --adopt-admin-kubeconfig=/tmp/crc.conf \
--adopt-infra-id=fakeinfra \
--adopt-cluster-id=fakeid
Checking the ClusterDeployment status:
~/hive$ kubectl get clusterdeployment crc -o json | jq .status.conditions
[
  {
    "lastProbeTime": "2021-02-02T14:21:02Z",
    "lastTransitionTime": "2021-02-02T14:21:02Z",
    "message": "cluster is reachable",
    "reason": "ClusterReachable",
    "status": "False",
    "type": "Unreachable"
  },
  {
    "lastProbeTime": "2021-02-02T01:45:19Z",
    "lastTransitionTime": "2021-02-02T01:45:19Z",
    "message": "SyncSet apply is successful",
    "reason": "SyncSetApplySuccess",
    "status": "False",
    "type": "SyncSetFailed"
  }
]
Tip: in case the cluster status is “unreachable”, that’s because Hive runs in a Kubernetes cluster deployed inside a container, and it is trying to access the CRC virtual machine that is controlled by libvirt. You will have to figure out you firewall, but this is what worked for me:
~/hive$ firewall-cmd --permanent --zone=trusted --change-interface=docker0
success
~/hive$ firewall-cmd --reload
success
SelectorSyncSet
Export the Hive kubeconfig:
~$ export KUBECONFIG=/tmp/hive.conf
Create a test SelectorSyncSet. Example:
apiVersion: v1
kind: List
metadata: {}
items:
  - apiVersion: hive.openshift.io/v1
    kind: SelectorSyncSet
    metadata:
      name: cso-test
    spec:
      clusterDeploymentSelector:
        matchLabels:
          api.openshift.com/cso-test: 'true'
      resourceApplyMode: Sync
      resources:
        - apiVersion: v1
          kind: Namespace
          metadata:
            annotations: {}
            labels: {}
            name: cso
Apply it:
~$ kubectl apply -f cso-test.yaml
selectorsyncset.hive.openshift.io/cso-test created
Now edit the ClusterDeployment of a cluster:
~$ kubectl edit clusterdeployment kind-cluster1
Adding the label api.openshift.com/cso-test: 'true' to it. Save and exit.
The cso namespace should be now created in the target cluster:
$ export KUBECONFIG=/tmp/cluster1.conf
$ oc get namespace cso
NAME   STATUS   AGE
cso    Active   81s
Cleanup
To clean-up, delete the two clusters and surrounding clutter:
~/hive$ kind delete cluster --name hive
~/hive$ kind delete cluster --name cluster1
~/hive$ docker rm -f kind-registry
~/hive$ docker network rm kind
1.2 - Getting Access
1.2.1 - Getting Backplane Access
Backplane
Backplane is the system used to provide access to the fleet of Openshift clusters. It
creates ssh tunnels and modifies your local ~/.kube/config.
Getting access
- Install ocm CLI
- Follow the instructions here
- Make sure your user is part of the
sd-mtsreRover group. - Wait for
https://gitlab.cee.redhat.com/service/authorizedkeys-builderto sync your ssh key onto the fleet of Openshift clusters - Install backplane CLI or use the PKGBUILD.
1.2.2 - Getting OCM API Access
1.3 -
Team Ceremonies
Sprint Duration
The Managed Tenants SRE Team lasts 3 full weeks.
Backlog Refinement
Every 3 weeks. 1h (max). Before the sprint ends; planned around half a week before the next sprint.
- Scrum Team comes together to refine issues in our backlog and to ensure that important issues are actionable for the next sprint.
- Product Owner owns the backlog and can communicate their needs and wishes to the Dev Team
- This includes:
- ensuring that the Definition of Ready is met for most of our issues
- sorting and prioritizing them
- estimating issue complexity with the team
Sprint Retro
Every 3 weeks. 30-minute (max). Before the sprint ends. Right now this happens right before the planning meeting for the next sprint:
- Scrum Team comes together to fine tune processes and other stuff that they deem important.
- The goals of continuous Retro meetings are:
- to inspect the current way of working
- and adapt it if necessary
- in small steps and an iterative fashion
- incorporate eventual process changes in the next sprint
- Guide that @jgwosdz used for our first retro
- Our retro dashboard with retros and derived action items: https://action.parabol.co/team/3heARr2dbz
Sprint Review
Every 3 weeks. 30-minute (max) meeting, hosted on the same day that the Sprint finishes:
- Scrum Team presents the results of their work to key stakeholders.
Sprint Planning
Every 3 weeks. 30-minute (max) hosted on the same day that the Sprint begins. Sprint Planning addresses the following topics:
- Why is this Sprint valuable?
- What can be Done this Sprint?
- How will the chosen work get done?
The Sprint Goal, the Product Backlog items selected for the Sprint, plus the plan for delivering them are together referred to as the Sprint Backlog.
Scrum Meeting
Every week. 1-hour (max) meeting for the Scrum Team with focus on progress towards the Sprint Goal and produces an actionable plan for the next week of work.
Each Scrum Team member will describe:
- Last week’s work.
- Plans for the next week.
- Blockers.
Weekly Tenants Sync
Every week. 1-hour (max) meeting for the Scrum Team and the Tenants to make announcements, collect feedback and discuss requirements.
Definition Of Ready/Done
Both definitions have been inlined into our issue template that live in a separate ’eversprint’
This is our jira project: https://issues.redhat.com/secure/RapidBoard.jspa?rapidView=8694&projectKey=MTSRE&view=planning
1.4 - Feature Flags in ADO
Currently, some ADO functionality, for example, addons plug and play, is hidden behind a feature flag.
Feature flags are specified in the AddonOperator resources under .spec.featureflags. This field is a string
which is a comma separated list of feature flags to enable. For addons plug and play and thus the addon package
to be enabled, the string ADDONS_PLUG_AND_PLAY has to be included in this field.
1.5 - Interrupt Catcher
The Interrupt Catcher is the entry-point for any tenant to get help, ask questions and raise issues. It’s our interface with our Tenants.
The MT-SRE Team member with the Interrupt Catcher responsibility can be reached out via the @mt-sre-ic Slack handle, in the #forum-managed-tenants channel.
Coverage
Each working day has 15 hours of IC “Follow The Sun” coverage:
- APAC: From 4:30 to 9:30 UTC
- EMEA: From 9:30 to 14:30 UTC
- NASA: From 14:30 to 19:30 UTC
Work items generated outside that time-frame will be picked up in the next FTS shift.
PagerDuty Schedule: https://redhat.pagerduty.com/schedules#PM3YCH1
Response Time
| Service Level Indicator (SLI) | SLO Time | MT-SRE “Goal Time” |
|---|---|---|
| MR’s to managed-tenants repositories | 24 FTSH* | 4 FTSH* |
| #forum-managed-tenants Slack messages, misc. support | best effort | 4 FTSH* |
*FTSH: Follow The Sun working Hours
Responsibilities
- Review Merge Requests created by the MT-SRE Tenants on the “Surfaces” repositories (listed in the next section)
- Respond to the alerts in the #sd-mt-sre-alert Slack channel
- Respond to incidents from PagerDuty
- Respond to questions and requests from the MT-SRE tenants in the #forum-managed-tenants Slack channel
- Engage on incidents with Addons that are on-boarding to the MT-SRE
- Handover the outstanding work to the next IC
Surfaces
- Slack channels:
#sd-mt-sre-info#mt-cs-sre-teamchat#mt-cs-sre-teamhandover#forum-managed-tenants
- Mailing lists:
- Git Repositories:
- https://gitlab.cee.redhat.com/service/managed-tenants-bundles (not automated)
- https://gitlab.cee.redhat.com/service/managed-tenants (tenants-related MRs, partially automated)
- https://gitlab.cee.redhat.com/service/managed-tenants-manifests (fully automated)
- https://gitlab.cee.redhat.com/service/managed-tenants-sops (tenants-related MRs, partially automated)
1.6 - Incident Management
Preparedness for major incidents is crucial. We have established the following Incident Management processes to ensure SREs can follow predetermined procedures:
Coverage
Layered Products SRE (LPSRE) provides 24x7 coverage and support.
If you need to escalate an incident, please refer to the Layered Products SRE Escalation Procedure.
NOTE: Only escalate an incident if the standard manual notification process using an OHSS ticket has failed.
1.7 - On-Call
https://source.redhat.com/groups/public/openshiftplatformsre/wiki/team_sd_sre_on_call_practices
2 - Onboarding
2.1 - Introduction
The Repeatable Onboarding for Managed Services (ROMS) article on source has a great introduction to managed services.
There are multiple steps to onboard a managed service:
- First the ROMS process needs to be completed.
- Then the onboardig acceptance criteria checklist has to be completed, along with other requirements, to onboard the addon to production.
- The addon must then pass a soak test.
- The addon then has to run in production for a given amount of time to prove its stability, and then the pager can be handed over. See the pager handover section for more information.
2.2 - ROMS
Please start at the ROMS documentation on the Source here to get an overview of managed services and ROMS.
Kickoff Overview
The Service Owners starts ROMS Checklist (including SAG review). SRES Architects will evaluate the service, determine whether it’s suitable and viable. If accepted it will receive a prioritization rating from the SRES Architects, and finally assigned to an SRE team by the Addon SRE Manager.
IMPORTANT: As an addon provider you can self-service onto OCM stage via the addon
flow and start prototyping before completing ROMS. You are free to experiment and
kick the tires! The only restrictions in place are the available support forums to
the Addon SRE team. These are limited to
#forum-managed-tenants
and to the weekly SD: Layered Products Sync call (You can request an invitation via #forum-managed-tenants)
Kickoff Steps
- Service Owner creates an Epic in the SDE board.
- Service Owner will request sign-off from SRES Architects: Paul Bergene, Jaime Melis and Karanbir Singh. Note that the preferred communication channels are the JIRA or the #sd-org channel.
- Service Owner includes reference to the SRES Onboarding Questionnaire (part of ROMS) in the epic.
- The epic should also reference a Service Definition Document. Service Definition examples: OSD, OCS, RHODS, RHOAM
- SRES Architects and the Addon SRE team lead will review the epic, discuss with the Service Owners and accept or reject it. SRES Architects will also assign a priority.
- Addon SRE lead will scope out the work needed to onboard the service into Addon SRE.
2.3 - Acceptance Criteria Checklist
Addon SRE Acceptance Criteria checklist
The Service Owners, with the assistance of the Addon SRE team, will deploy the service to production while the SLOs are being implemented and fine-tuned. The Addon SRE onboarding team will work through the Addon SRE Acceptance Criteria Checklist process.
Additional Requirements
There are also requirements from other teams, which can be found here.
Next Steps
If all requirements are passed successfully, the service owners will be allowed to deploy to production. Once the service is running in production, the service can begin its transition period. This is where an addon proves its stability for a given amount of time and then the pager is handed over to the SRE team. Read more about the transition period here.
2.4 - Pager Handover
Transition Overview
This stage focuses on the viability of the service. If, after an agreed amount of time of being in production(defaults to a 4-week rolling window), the service meets its SLOs then it will be considered viable by SRE and the pager will be transferred to the Addon SRE team.
Viability Steps
- The service runs in production and SLO data is collected.
- An Addon SRE reviews the SLOs and SOPs.
- If the SLOs are met, the service will be transitioned to Addon SRE.
- Any critical alerts will be routed to the Addon SRE 24x7 PagerDuty escalation policy.
Further Links
For information on how to set up the PagerDuty integration for your addon, see the PagerDuty Integration documentation.
2.5 - Soak Test
WIP
3 - Release Process
3.1 - Gating for Production
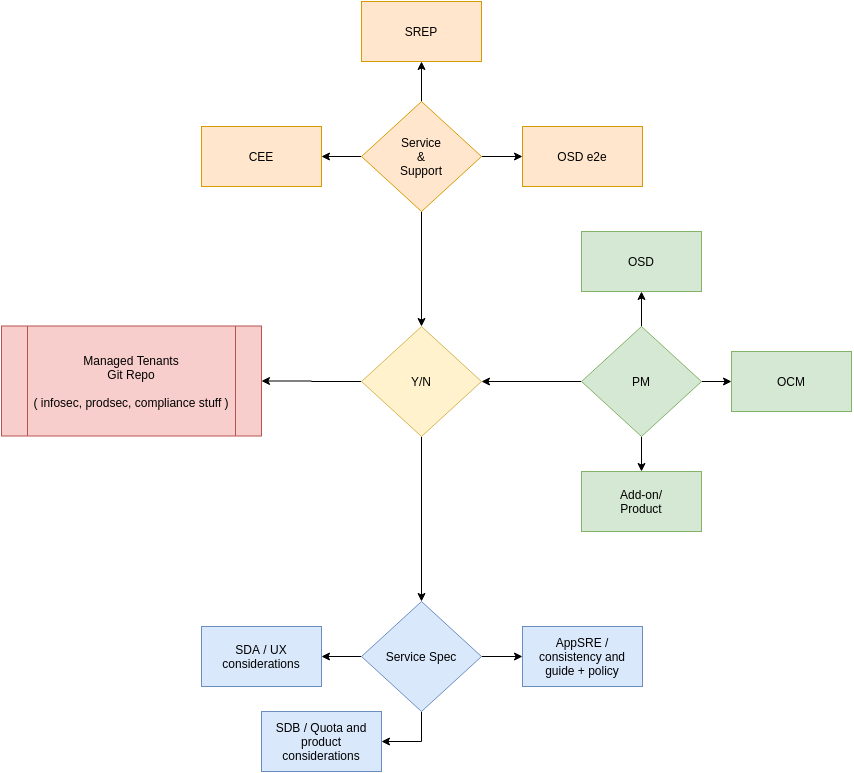
This process intends to allow any addon to get to PROD, but not be sold to customers. Before an addon is enabled for customer consumption, various teams have to validate and agree on the content, product, and service.
The focus is on three areas:
Service & Support
- Layered SRE (if present): payload consistency and policy for upgrades, testing, supportability, escalation paths + IMS; complements the Managed Tenants SRE scope, but does not replace it.
- SRE-P: OSD/ ROSA 3-R’s
- CEE : SBR & context + Docs + IMS
- OSD e2e: for CD Signal
- OSD SRE: Ensure OSD sanity
- Platform & Payload
PM / Biz
- OSD / ROSA
- OCM
- Addon / Product
Spec & technical patterns
- ServiceDev A : UX & CS
- ServiceDev B : SKU, Quota, rBac - AMS
- Managed Tenants SRE : consistency & Policy for payload delivery, upgrades, testing
Indicating agreement
Each team in the scope above needs to explicitly indicate agreement for the go-live signal. This can be done via a +1 / LGTM signal on the Merge Request that ‘Releases Content for non-Red Hat consumption’ or via a linked JIRA where the SKU rules are requested to go live. The go-Live signal is normally defined as either when the SKUs are enabled with AMS delivering quota reconcile against it, or it could just be a ‘Free with OSD’ / ‘Free overall’.
Get to Prod consideration
Promoting an addon to prod does not automatically mean it can be consumed by a non-Red Hat person e.g. a customer. Therefore, a reduced set of criteria applies for getting content and the addon itself available to Dev, QE, CEE, SRE, Docs and other associated teams.
Baseline criteria then needed for the promote-to-prod is reduced to:
- Managed Tenants SRE agrees on consistency and policy
- Passing thorough testing via OSD e2e for CD Signal
- SREP approve and sign off on early content landing in production
- Dev team has signed off on content being consumed
As a fallout of this reduced criteria the corresponding OSD cluster that lands this addon, gets a potentially lower Service assurance from the various SRE and CEE teams.
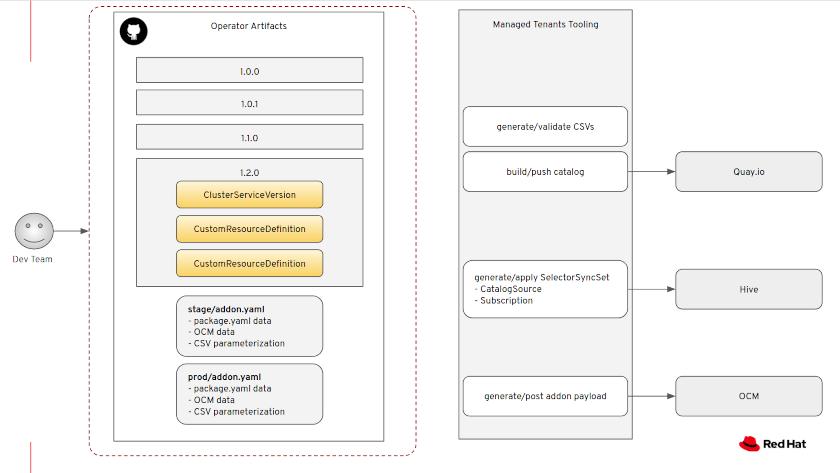
Approval and example data flow
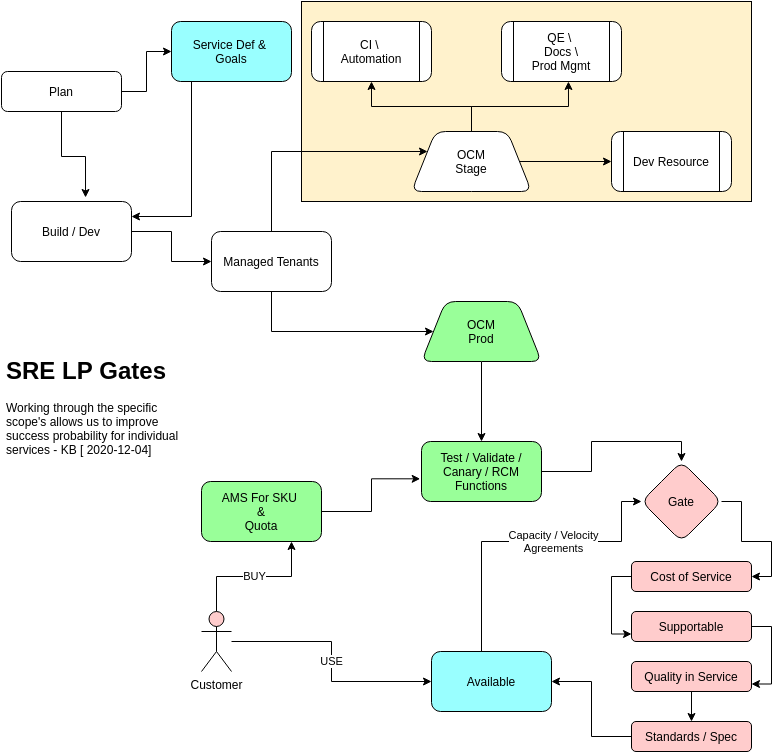
The yellow box indicates short-lived, non-customer facing infra.
Primary Takeaway:
- As a developer you can deliver content into Integration or Stage as long as you meet the basic technical requirements. Other than the eng team and SRE baseline requirements there are no gates applied.
- To get content available in Production OCM, a wider set of considerations must be met - including sign off from Managed Tenants SRE and OSD-e2e that the platform is not being compromised, and no forward-looking feature work is being exposed/exploited.
- To release the product to customers, ALL criteria must be met, including, but not limited to, demonstrated viability and support cover, service definitions and demonstrated SLIs, before you can. Titles like Beta, Alpha, GA, Tech Preview etc. are removed from the state of service, and are not something SRE participates in.
- As a part of making your content available to customers, SRE will agree on capacity and velocity numbers based things like cost of service, human and service toil etc. The expectation is that there will be no more customers than the agreed capacity, and the instance of the product will remain within the agreed velocity and service goals.
4 - Addons Flow
4.1 - Addons Flow Architecture
Add-Ons are Operators. As such, Add-Ons are installed using typical Operator
objects, like Subscription, OperatorGroup and CatalogSource.
To get those objects into the OpenShift clusters, we rely on OCM and Hive. You can read more about Hive in this blog post.
Deployment
Our input is the Add-On metadata file
(managed-tenants/addons/<addon_name>/metadata/<stage|prod>/addon.yaml)
and the corresponding bundles directories
(managed-tenants-bundles/addons/<addon_name>/).
With that in place, we will:
- Build the Operator catalog container image.
- Push the catalog image to our organization repository in Quay.io.
- Generate a
SyncSet
with the Operator install objects.
- Apply the SyncSet to Hive.
- Generate the OCM API payload.
- Post the payload to OCM.
The Managed Tenants CI is in charge of processing the input and deploying all the artifacts. This image shows the data flows:
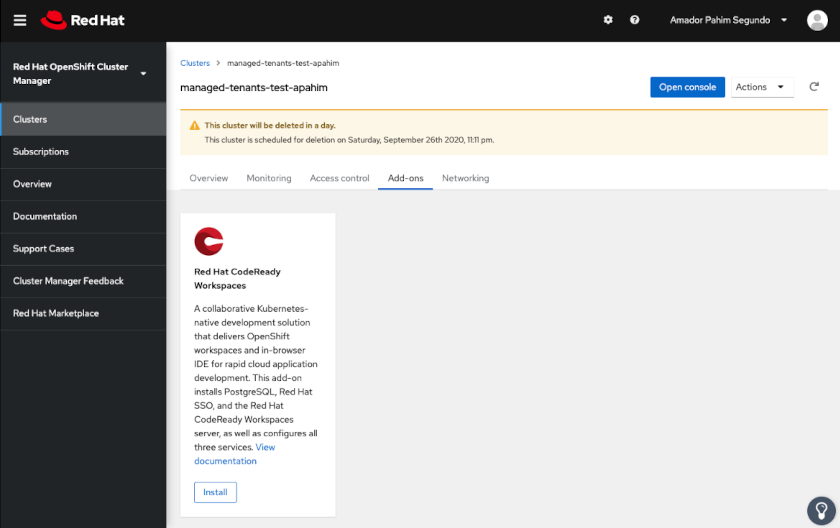
With that in place, OCM will present an “Add-Ons” tab, listing all the Add-Ons that your organization has quota for. Example:
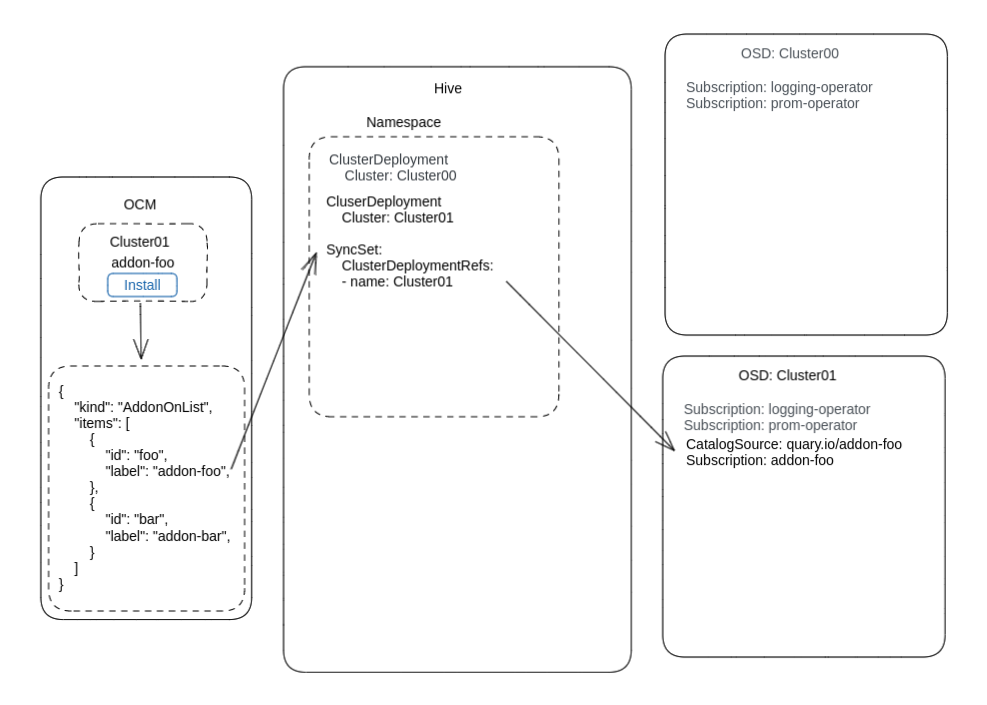
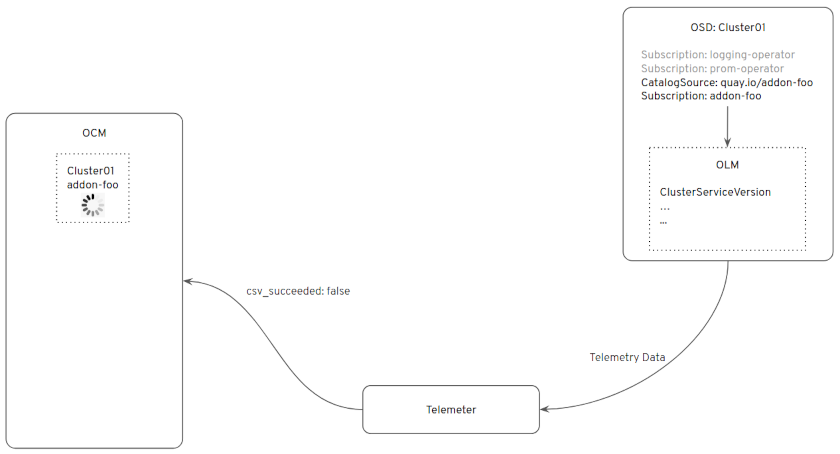
Installation
When you click “Install” in the OCM Web UI, under the hood, OCM creates a
SyncSet object
in Hive. The SyncSet object references the cluster in which the addon was just
installed in the clusterDeploymentRefs field.
From there, OLM will take over, installing the Operator in the OpenShift
cluster. While OLM is installing the Operator, OCM will keep polling the
telemetry data reported by the cluster, waiting for the csv_succeeded=1
metric from that Operator:
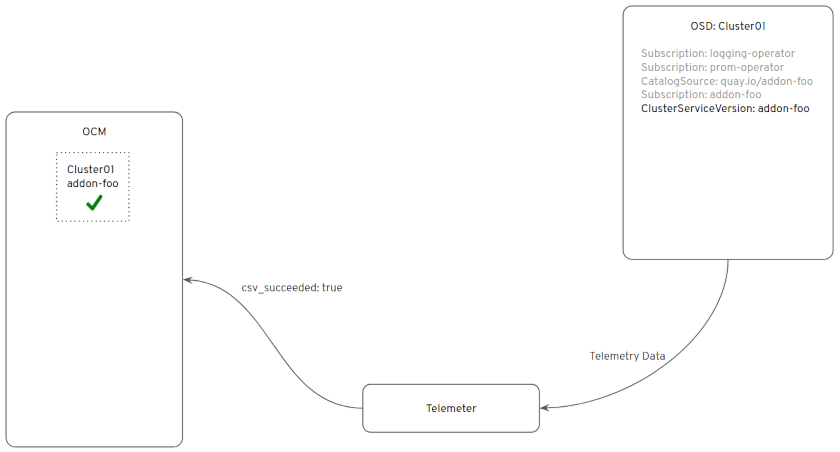
At some point, when the Operator is fully installed, OCM will reflect that in the Web UI:
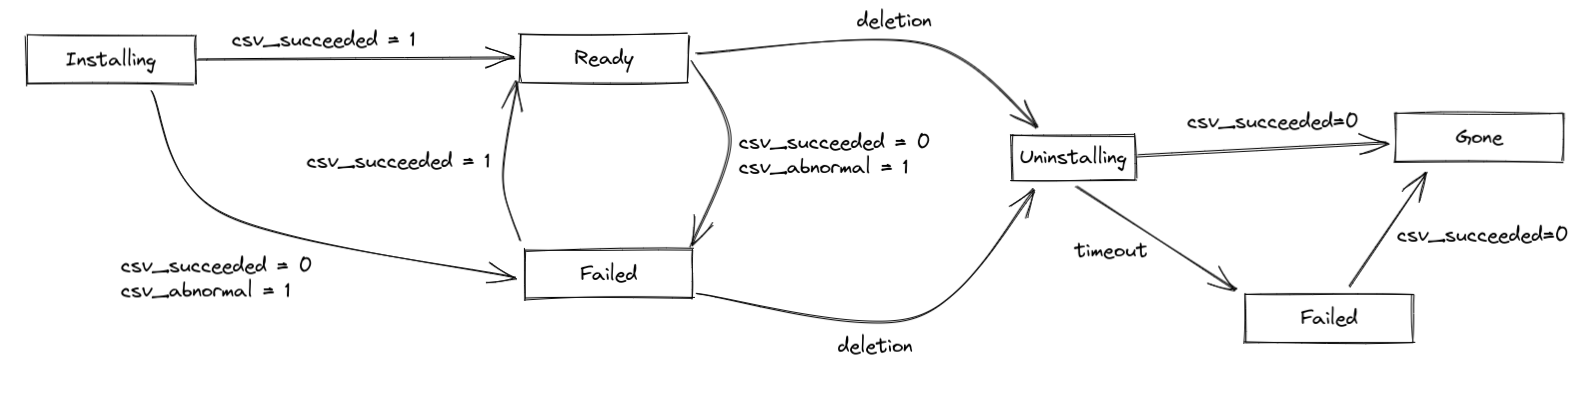
Addon Status Lifecycle
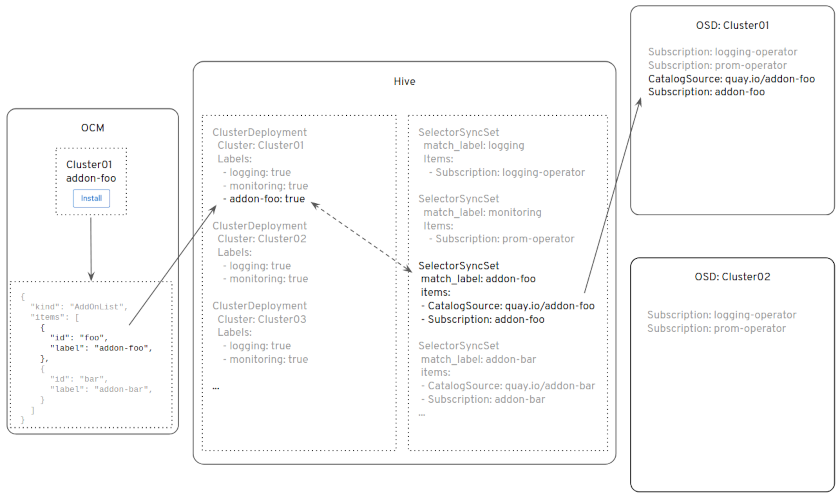
Deprecated SelectorSyncSet Installation
 When you click “Install” in the OCM Web UI, under the hood, OCM will apply
a label to the corresponding
When you click “Install” in the OCM Web UI, under the hood, OCM will apply
a label to the corresponding ClusterDeployment object in Hive.
That label is the same label used in the SelectorSyncSet as a matchLabel.
With the ClusterDeployment label now matching the SelectorSyncSet label,
Hive will apply all the objects in the SelectorSyncSet to the target cluster:
4.2 - APIs
You can find the Addons APIs here under
the paths /api/clusters_mgmt/v1/addons/{addon_id},
/api/clusters_mgmt/v1/clusters/{cluster_id}/addon_inquiries and
/api/clusters_mgmt/v1/clusters/{cluster_id}/addons/{addoninstallation_id}.
4.3 - Metrics
Addon Operator Metrics
Addon operator metrics can be found in PromLens
in the osd-observatorum-production datasource.
The metrics are configured in the lifecycler repo and the managed-cluster-config repo. See the following two merge requests for reference: lifecycler MR and managed-cluster-config MR.
csv_succeeded and csv_abnormal Metrics
csv_succeeded and csv_abnormal Metrics can be found in production Thanos
and stage Thanos.
It can be useful to query for csv_succeeded and csv_abnormal Metrics
by operator name, for example csv_succeeded{name=~"ocs-operator.*"}, or
by cluster id, for example csv_succeeded{_id="049ea229-55dd-4e30-a2f0-87ae1dd37de6"}.
5 - Creating Addons
5.1 - Monitoring Addons
5.1.1 - SLO Dashboards
Development teams are required to co-maintain, in conjunction with the MT-SRE Team, SLO Dashboards for the Addons they develop. This document explains how to bootstrap the dashboard creation and deployment.
First Dashboard
- Fork/clone the managed-tenants-slos repository.
- Create the following directory structure:
├── <addon-name>
│   ├── dashboards
│   │   └── <addon-name>-slo-dashboard.configmap.yaml
│   └── OWNERS
.
Example OWNERS:
approvers:
- akonarde
- asegundo
<addon-name>-slo-dashboard.configmap.yaml contents (replace all occurrences of <addon-name>):
apiVersion: v1
kind: ConfigMap
metadata:
  name: <addon-name>-slo-dashboard
  labels:
    grafana_dashboard: "true"
  annotations:
    grafana-folder: /grafana-dashboard-definitions/Addons
data:
  mtsre-rhods-slos.json: |
    {
      "annotations": {
        "list": [
          {
            "builtIn": 1,
            "datasource": {
              "type": "grafana",
              "uid": "-- Grafana --"
            },
            "enable": true,
            "hide": true,
            "iconColor": "rgba(0, 211, 255, 1)",
            "name": "Annotations & Alerts",
            "target": {
              "limit": 100,
              "matchAny": false,
              "tags": [],
              "type": "dashboard"
            },
            "type": "dashboard"
          }
        ]
      },
      "editable": true,
      "fiscalYearStartMonth": 0,
      "graphTooltip": 0,
      "links": [],
      "liveNow": false,
      "panels": [
        {
          "datasource": {
            "type": "prometheus",
            "uid": "4rNsqZfnz"
          },
          "fieldConfig": {
            "defaults": {
              "color": {
                "mode": "thresholds"
              },
              "custom": {
                "align": "auto",
                "displayMode": "auto",
                "inspect": false
              },
              "mappings": [],
              "thresholds": {
                "mode": "absolute",
                "steps": [
                  {
                    "color": "green",
                    "value": null
                  },
                  {
                    "color": "red",
                    "value": 80
                  }
                ]
              }
            },
            "overrides": []
          },
          "gridPos": {
            "h": 16,
            "w": 3,
            "x": 0,
            "y": 0
          },
          "id": 2,
          "options": {
            "footer": {
              "fields": "",
              "reducer": [
                "sum"
              ],
              "show": false
            },
            "showHeader": true
          },
          "pluginVersion": "9.0.1",
          "targets": [
            {
              "datasource": {
                "type": "prometheus",
                "uid": "4rNsqZfnz"
              },
              "editorMode": "code",
              "expr": "group by (_id) (subscription_sync_total{name=\"${addon_name}\"})",
              "format": "table",
              "range": true,
              "refId": "A"
            }
          ],
          "title": "Clusters",
          "transformations": [
            {
              "id": "groupBy",
              "options": {
                "fields": {
                  "_id": {
                    "aggregations": [],
                    "operation": "groupby"
                  }
                }
              }
            }
          ],
          "type": "table"
        }
      ],
      "schemaVersion": 36,
      "style": "dark",
      "tags": [],
      "templating": {
        "list": [
          {
            "hide": 2,
            "name": "addon_name",
            "query": "addon-<addon-name>",
            "skipUrlSync": false,
            "type": "constant"
          }
        ]
      },
      "time": {
        "from": "now-6h",
        "to": "now"
      },
      "timepicker": {},
      "timezone": "",
      "title": "<addon-name> - SLO Dashboard",
      "version": 0,
      "weekStart": ""
    }
- Create a Merge Request adding the files to the managed-tenants-slos git repository.
- Ping @mt-sre-ic in the #forum-managed-tenants Slack channel for review.
Dashboard Deployment
Merging of the above merge request is a prerequisite for this step.
The dashboard deployment happens through app-interface, using saas-files.
- For each new Addon, we need to create a new saas-file in app-interface.
- Give ownership of the saas-file to your team using an app-interface role file.
Example Merge Request content to app-interface:
- Ping
@mt-sre-icin the#forum-managed-tenantsSlack channel for approval. - Merge Requests to app-interface are constantly reviewed/merged by AppSRE. After the MT-SRE approval, wait until the Merge Request is merged.
Accessing the Dashboards
Once the app-interface merge request is merged, you will see your ConfigMaps
being deployed in the #sd-mt-sre-info Slack channel. For example:
[app-sre-stage-01] ConfigMap odf-ms-cluster-status applied
...
[app-sre-prod-01] ConfigMap odf-ms-cluster-status applied
Once the dashboards are deployed, you can see them here:
- STAGE: https://grafana.stage.devshift.net/dashboards/f/aGqy3WB7k/addons
- PRODUCTION: https://grafana.app-sre.devshift.net/dashboards/f/sDiLLtgVz/addons
Development Flow
After all the configuration is in place:
STAGE:
- Dashboards on the STAGE Grafana instance should not be used by external audiences other than the people developing the dashboards.
- Changes in the
managed-tenants-slosrepository can be merged by the development team with “/lgtm” comments from those in the OWNERS file. - After merged, changes are automatically delivered to the STAGE grafana instance.
PRODUCTION:
- The dashboards on the PRODUCTION Grafana are pinpointed to a specific git commit from the managed-tenants-slos repository in the corresponding saas-file in app-interface.
- After patching the git commit in the saas-file, owners of the saas-file can merge the promotion with a “/lgtm” comment in the app-interface Merge Request.
5.1.2 - Dead Man's Snitch Operator Integration
Overview
Dead Man’s Snitch (DMS) is essentially a constantly firing prometheus alert and an external receiver (called a snitch) that will alert should the monitoring stack go down and stop sending alerts. The generation of the snitch URLs is done dynamically via the DMS operator, which runs on hive and is owned by SREP. The snitch URL shows up in a secret.
Usage
The Add-On metadata file (addon.yaml) allows you to provide
a deadmanssnitch field (see deadmansnitch field in
the Add-On metadata file
schema documentation
for more information).
This field allows you to provide the required Dead Man’s Snitch integration configuration.
A DeadmansSnitchIntegrationresource is then created and applied to Hive alongside the Add-On
SelectorSyncSet (SSS).
DeadmansSnitchIntegration Resource
The default DMS configurations which will be created if you specify the bare minimum fields under ‘deadmanssnitch’ field in addon metadata:
- apiVersion: deadmanssnitch.managed.openshift.io/v1alpha1
  kind: DeadmansSnitchIntegration
  metadata:
    name: addon-{{ADDON.metadata['id']}}
    namespace: deadmanssnitch-operator
  spec:
    clusterDeploymentSelector: ## can be overridden by .deadmanssnitch.clusterDeploymentSelector field in addon metadata
      matchExpressions:
      - key: {{ADDON.metadata['label']}}
        operator: In
        values:
        - "true"

    dmsAPIKeySecretRef: ## fixed
      name: deadmanssnitch-api-key
      namespace: deadmanssnitch-operator

    snitchNamePostFix: {{ADDON.metadata['id']}} ## can be overridden by .deadmanssnitch.snitchNamePostFix field in addon metadata

    tags: {{ADDON.metadata['deadmanssnitch']['tags']}} ## Required

    targetSecretRef:
      ## can be overridden by .deadmanssnitch.targetSecretRef.name field in addon metadata
      name: {{ADDON.metadata['id']}}-deadmanssnitch
      ## can be overridden by .deadmanssnitch.targetSecretRef.namespace field in addon metadata
      namespace: {{ADDON.metadata['targetNamespace']}}
Examples of deadmanssnitch field in addon.yaml
id: ocs-converged
....
....
deadmanssnitch:
  tags: ["ocs-converged-stage"]
....
id: managed-odh
....
....
deadmanssnitch:
  snitchNamePostFix: rhods
  tags: ["rhods-integration"]
  targetSecretRef:
    name: redhat-rhods-deadmanssnitch
    namespace: redhat-ods-monitoring
....
id: managed-api-service-internal
....
....
deadmanssnitch:
  clusterDeploymentSelector:
    matchExpressions:
    - key: "api.openshift.com/addon-managed-api-service-internal"
      operator: In
      values:
      - "true"
    - key: "api.openshift.com/addon-managed-api-service-internal-delete"
      operator: NotIn
      values:
      - 'true'
  snitchNamePostFix: rhoam
  tags: ["rhoam-production"]
  targetSecretRef:
    name: redhat-rhoami-deadmanssnitch
    namespace: redhat-rhoami-operator
Generated Secret
A secrete will be generated (by default in the same namespace as your addon) with the SNITCH_URL.
Your add-on will need to pick up the generated secret in cluster and inject it into your
alertmanager config. Example of in-cluster created secret:
kind: Secret
apiVersion: v1
metadata:
  namespace: redhat-myaddon-operator
  labels:
    hive.openshift.io/managed: 'true'
data:
  SNITCH_URL: #url like https://nosnch.in/123123123
type: Opaque
Alert
Your alertmanager will need a constantly firing alert that is routed to DMS: Example of an alert that always fires:
- name: DeadManSnitch
  interval: 1m
  rules:
    - alert: DeadManSnitch
      expr: vector(1)
      labels:
        severity: critical
      annotations:
        description: This is a DeadManSnitch to ensure RHODS monitoring and alerting pipeline is online.
        summary: Alerting DeadManSnitch
Route
Example of a route that forwards the firing-alert to DMS:
- match:
    alertname: DeadManSnitch
  receiver: deadman-snitch
  repeat_interval: 5m
Receiver
Example receiver for DMS:
- name: 'deadman-snitch'
  webhook_configs:
  - url: '<snitch_url>?m=just+checking+in'
    send_resolved: false
tags: ["my-addon-production"]
in the Service Delivery DMS account to their pagerduty service.Please log a JIRA with your assigned SRE team to have this completed at least one week before going live with the SRE team.
Current Example
5.1.3 - PagerDuty Integration
The PagerDuty integration is configured in the pagerduty field in the
addon.yaml metadata file.
Given this configuration, a secret with the specified name is created in the
specified namespace by the PagerDuty Operator,
which runs on Hive. The secret contains the PAGERDUTY_KEY.
5.1.4 - OCM SendGrid Service Integration
OCM SendGrid Service is an event driven service that manages SendGrid subuser accounts and credential bundles based on addon cluster logs.
The secret name and namespace are configured in app interface, see this section in the documentation.
5.2 - Testing Addons
5.2.1 - Installing a specific version of an Addon in a staging environment
Add-on services are typically installed using the OpenShift Cluster Manager web console, by selecting the specific addon from the Add-ons tab and clicking Install. However, only the latest version of an addon service can be installed using the OpenShift Cluster Manager console.
In some cases, you might need to install an older version of an addon, for example, to test the upgrade of an addon from one version to the next. Follow this procedure to install a specific version of an addon service in a staging environment.
IMPORTANT: Installing an addon service using this procedure is only recommended for testing upgrades in a staging environment and is not supported for customer-facing production workloads.
Prerequisites
You have the
version_selectcapability added to your organization by creating a merge request to the ocm-resources respository.For more information about assigning capabilities to an organization, see Customer Capabilities Management. For more information about enabling the
version_selectcapability, see organization YAML example and merge request example.
Procedure
Create a JSON file with the addon service and addon version that you want to install. In this example, the JSON file is
install-payload.json, the addon id isreference-addon, and the version we want to install is0.6.7.Example
{
 "addon": {
   "id": "reference-addon"
 },
 "addon_version": {
   "id": "0.6.7"
 }
}
NOTE: If the addon that you are installing has a required parameter, ensure that you add it to the JSON file. For instance, the
managed-odhaddon, which is shown in the example below, requires the parameternotification-emailto be included.Example
{
  "addon": {
    "id": "managed-odh"
},
  "addon_version": {
    "id": "1.23.0"
},
  "parameters": {
        "items": [
        {
          "id": "notification-email",
          "value": "me@somewhere.com"
        }
      ]
    }
}
Set the
CLUSTER_IDenvironment variable:export CLUSTER_ID=<your_cluster_internal_id>Run the following API request to install the addon:
ocm post /api/clusters_mgmt/v1/clusters/$CLUSTER_ID/addons --body install-payload.jsonVerify the addon installation:
Log into your cluster:
oc loginRun the
oc get addonscommand to view the addon installation status:$ oc get addons NAME STATUS AGE reference-addon Pending 10mOptionally, run the
watchcommand to watch the addon installation status:$ watch oc get addons NAME STATUS AGE reference-addon Ready 32m
If you do not want the addon to automatically upgrade to the latest version after installation, delete the addon upgrade policy before the addon installation completes.
List the upgrade policies:
Example
$ ocm get /api/clusters_mgmt/v1/clusters/$CLUSTER_ID/addon_upgrade_policies
{
"kind": "AddonUpgradePolicyList",
"page": 1,
"size": 1,
"total": 1,
"items": [
 {
  "kind": "AddonUpgradePolicy",
  "id": "991a69a5-ce33-11ed-9dda-0a580a8308f5",
  "href": "/api/clusters_mgmt/v1/clusters/22ogsfo8kd36bk280b6bqbi7l03micmm/addon_upgrade_policies/991a69a5-ce33-11ed-9dda-0a580a8308f5",
  "schedule": "0,15,30,45 * * * *",
  "schedule_type": "automatic",
  "upgrade_type": "ADDON",
  "version": "",
  "next_run": "2023-03-29T19:30:00Z",
  "cluster_id": "22ogsfo8kd36bk280b6bqbi7l03micmm",
  "addon_id": "reference-addon"
 }
]
}
Delete the addon upgrade policy:
Syntax
ocm delete /api/clusters_mgmt/v1/clusters/$CLUSTER_ID/addon_upgrade_policies/<addon_upgrade_policy_id>Example
ocm delete /api/clusters_mgmt/v1/clusters/$CLUSTER_ID/addon_upgrade_policies/991a69a5-ce33-11ed-9dda-0a580a8308f5Verify the upgrade policy no longer exists:
Syntax
ocm get /api/clusters_mgmt/v1/clusters/$CLUSTER_ID/addon_upgrade_policies | grep <addon_upgrade_policy_id>Example
ocm get /api/clusters_mgmt/v1/clusters/$CLUSTER_ID/addon_upgrade_policies | grep 991a69a5-ce33-11ed-9dda-0a580a8308f5
Review the addon installation status and version:
Example
$ oc get addons reference-addon -o yaml
apiVersion: addons.managed.openshift.io/v1alpha1
kind: Addon
metadata:
  annotations:
 ...
 creationTimestamp: "2023-03-20T19:07:08Z"
 finalizers:
 - addons.managed.openshift.io/cache
 ...
spec:
displayName: Reference Addon
 ...
 pause: false
 version: 0.6.7
status:
  conditions:
  - lastTransitionTime: "2023-03-20T19:08:10Z"
    message: ""
    observedGeneration: 2
    reason: FullyReconciled
    status: "True"
    type: Available
  - lastTransitionTime: "2023-03-20T19:08:10Z"
    message: Addon has been successfully installed.
    observedGeneration: 2
    reason: AddonInstalled
    status: "True"
    type: Installed
 lastObservedAvailableCSV: redhat-reference-addon/reference-addon.v0.6.7
 observedGeneration: 2
 observedVersion: 0.6.7
 phase: Ready
In this example, you can see the addon version is set to
0.6.7andAddonInstalledstatus isTrue.(Optional) If needed, recreate the addon upgrade policy manually.
Create a JSON file with the addon upgrade policy information.
Example of automatic upgrade
{
  "kind": "AddonUpgradePolicy",
  "addon_id": "reference-addon",
  "cluster_id": "$CLUSTER_ID",
  "schedule_type": "automatic",
  "upgrade_type": "ADDON"
}
Example of manual upgrade
{
  "kind": "AddonUpgradePolicy",
  "addon_id": "reference-addon",
  "cluster_id": "$CLUSTER_ID",
  "schedule_type": "manual",
  "upgrade_type": "ADDON",
  "version": "0.7.0"
}
In the example above, the schedule_type for the
reference-addonis set tomanualand the version to upgrade to is set0.7.0. The upgrade policy will execute once and the addon will upgrade to version0.7.0.Run the following API request to install the addon upgrade policy:
Syntax
ocm post /api/clusters_mgmt/v1/clusters/$CLUSTER_ID/addon_upgrade_policies --body <your_json_filename>Example
ocm post /api/clusters_mgmt/v1/clusters/$CLUSTER_ID/addon_upgrade_policies --body reference-upgrade-policy.jsonVerify the upgrade policy exists:
Syntax
ocm get /api/clusters_mgmt/v1/clusters/$CLUSTER_ID/addon_upgrade_policies | jq '.items[] | select(.addon_id=="<addon_id>")'Example
ocm get /api/clusters_mgmt/v1/clusters/$CLUSTER_ID/addon_upgrade_policies | jq '.items[] | select(.addon_id=="reference-addon")'
Useful commands
Get a list of available addons:
ocm get /api/clusters_mgmt/v1/addons | jq '.items[].id'Get a list of available versions to install for a given addon id:
Syntax
ocm get /api/clusters_mgmt/v1/addons/<addon-id>/versions | jq '.items[].id'Example
$ ocm get /api/clusters_mgmt/v1/addons/reference-addon/versions | jq '.items[].id'
"0.0.0"
"0.1.5"
"0.1.6"
"0.2.2"
"0.3.0"
"0.3.1"
"0.3.2"
"0.4.0"
"0.4.1"
"0.5.0"
"0.5.1"
"0.6.0"
"0.6.1"
"0.6.2"
"0.6.3"
"0.6.4"
"0.6.5"
"0.6.6"
"0.6.7"
"0.7.0"
5.2.2 - Testing With OCP (Without OCM)
Testing Without OCM
During the development process, it might be useful (and cheaper) to run your addon on an OCP cluster.
You can spin up an OCP cluster on your local machine using CRC.
OCP and OSD differ in one important aspect: OCP gives you full access, while OSD restricts the administrative actions. But Managed Tenants will apply resources as unrestricted admin to OSD, just like you can do with your OCP, so OCP is a good OSD mockup for our use case.
By doing this, you’re skipping:
- OCM and SKU management
- Hive
First, you have to build your catalog. Let take the managed-odh as example:
$ managedtenants --environment=stage --addons-dir addons --dry-run run --debug tasks/deploy/10_build_push_catalog.py:managed-odh
Loading stage...
Loading stage OK
== TASKS =======================================================================
tasks/deploy/10_build_push_catalog.py:BuildCatalog:managed-odh:stage...
 -> creating the temporary directory
 -> /tmp/managed-odh-stage-1bkjtsea
 -> generating the bundle directory
 -> generating the bundle package.yaml
 -> building the docker image
 -> ['docker', 'build', '-f', PosixPath('/home/apahim/git/managed-tenants/Dockerfile.catalog'), '-t', 'quay.io/osd-addons/opendatahub-operator:stage-91918fe', PosixPath('/tmp/managed-odh-stage-1bkjtsea')]
tasks/deploy/10_build_push_catalog.py:BuildCatalog:managed-odh:stage OK
tasks/deploy/10_build_push_catalog.py:PushCatalog:managed-odh:stage...
 -> pushing the docker image
 -> ['docker', '--config', '/home/apahim/.docker', 'push', 'quay.io/osd-addons/opendatahub-operator:stage-91918fe']
tasks/deploy/10_build_push_catalog.py:PushCatalog:managed-odh:stage OK
That command has built the image
quay.io/osd-addons/opendatahub-operator:stage-91918fe on your local machine.
You can inspect the image with:
$ docker run --rm -it --entrypoint "bash"  quay.io/osd-addons/opendatahub-operator:stage-91918fe -c "ls manifests/"
0.8.0  1.0.0-experiment  managed-odh.package.yml

$ docker run --rm -it --entrypoint "bash"  quay.io/osd-addons/opendatahub-operator:stage-91918fe -c "cat manifests/managed-odh.package.yml"
channels:
- currentCSV: opendatahub-operator.1.0.0-experiment
  name: beta
defaultChannel: beta
packageName: managed-odh
Next, you have to tag/push that image to some public registry repository of yours:
$ docker tag quay.io/osd-addons/opendatahub-operator:stage-91918fe quay.io/<my-repository>/opendatahub-operator:stage-91918fe
$ docker push quay.io/<my-repository>/opendatahub-operator:stage-91918fe
Getting image source signatures
Copying blob 9fbc4a1ed0b0 done
Copying blob c4d8f7894b7d skipped: already exists
Copying blob 61598d8d1b24 skipped: already exists
Copying blob 38ada4bcd26f skipped: already exists
Copying blob d5fdf1f627c8 skipped: already exists
Copying blob 2bf094d88b12 skipped: already exists
Copying blob 8a6c7bacb5db done
Copying config 3088e48540 done
Writing manifest to image destination
Copying config 3088e48540 [--------------------------------------] 0.0b / 3.6KiB
Writing manifest to image destination
Writing manifest to image destination
Storing signatures
Now we have to apply the OpenShift resources that will install the operator
in the OCP cluster. You can use the managedtenants command to generate
the stage SelectorSyncSet and look at it for reference:
$ managedtenants --environment=stage --addons-dir addons --dry-run run --debug tasks/generate/99_generate_SelectorSyncSet.py
Loading stage...
Loading stage OK
== POSTTASKS ===================================================================
tasks/generate/99_generate_SelectorSyncSet.py:GenerateSSS:stage...
 -> Generating SSS template /home/apahim/git/managed-tenants/openshift/stage.yaml
tasks/generate/99_generate_SelectorSyncSet.py:GenerateSSS:stage OK
Here’s the SelectorSyncSet snippet we are interested in:
---
- apiVersion: hive.openshift.io/v1
  kind: SelectorSyncSet
  metadata:
    name: addon-managed-odh
  spec:
    clusterDeploymentSelector:
      matchLabels:
        api.openshift.com/addon-managed-odh: "true"
    resourceApplyMode: Sync
    resources:
      - apiVersion: v1
        kind: Namespace
        metadata:
          annotations:
            openshift.io/node-selector: ""
          labels: null
          name: redhat-opendatahub
      - apiVersion: operators.coreos.com/v1alpha1
        kind: CatalogSource
        metadata:
          name: addon-managed-odh-catalog
          namespace: openshift-marketplace
        spec:
          displayName: Managed Open Data Hub Operator
          image: quay.io/osd-addons/opendatahub-operator:stage-${IMAGE_TAG}
          publisher: OSD Red Hat Addons
          sourceType: grpc
      - apiVersion: operators.coreos.com/v1alpha2
        kind: OperatorGroup
        metadata:
          name: redhat-layered-product-og
          namespace: redhat-opendatahub
      - apiVersion: operators.coreos.com/v1alpha1
        kind: Subscription
        metadata:
          name: addon-managed-odh
          namespace: redhat-opendatahub
        spec:
          channel: beta
          name: managed-odh
          source: addon-managed-odh-catalog
          sourceNamespace: openshift-marketplace
Our OpenShift manifest to be applied to the OCP cluster looks as follows:
kind: List
metadata: {}
apiVersion: v1
items:
  - apiVersion: v1
    kind: Namespace
    metadata:
      name: redhat-opendatahub
  - apiVersion: operators.coreos.com/v1alpha1
    kind: CatalogSource
    metadata:
      name: addon-managed-odh-catalog
    spec:
      displayName: Managed Open Data Hub Operator
      image: quay.io/<my-repository>/opendatahub-operator:stage-91918fe
      publisher: OSD Red Hat Addons
      sourceType: grpc
  - apiVersion: operators.coreos.com/v1alpha2
    kind: OperatorGroup
    metadata:
      name: redhat-layered-product-og
  - apiVersion: operators.coreos.com/v1alpha1
    kind: Subscription
    metadata:
      name: addon-managed-odh
    spec:
      channel: beta
      name: managed-odh
      source: addon-managed-odh-catalog
      sourceNamespace: openshift-marketplace
Finally, apply it to the OCP cluster:
$ oc apply -f manifest.yaml
Namespace/redhat-opendatahub created
CatalogSource/addon-managed-odh-catalog created
Subscription/addon-managed-odh created
OperatorGroup/redhat-layered-product-og created
Your operator should be installed in the cluster.
5.2.3 - Testing With OSD-E2E
Testing With OSD-E2E
All Add-Ons must have a reference to a test harness container in a publicly available repository. The Add-On development team is responsible for creating and maintaining the test harness image. That image is generated by the OSD e2e process.
The test harness will be tested against OCP nightly and OSD next.
Please refer to the OSD-E2E Add-On Documentation for more details on how this test harness will be run and how it is expected to report results.
Primer into OSD E2E tests and prow jobs
To ensure certain things such as validating that the addon can be easily and successfully installed on a customer’s cluster, we have prow jobs setup which run e2e tests (one test suite per addon) every 12 hours. If the e2e tests corresponding to any addon fail, then automated alerts/notifications are sent to the addon team. Every addon’s e2e tests are packaged in an image called “testHarness”, which is built and pushed to quay.ioby the team maintaining the addon. Once the “testHarness” image is built and pushed, the team must register their addon to testHarness image’s e2e tests by making a PR against this file.
You can access the portal for prow jobs here. The prow jobs follow the below steps to run the e2e tests. For every e2e test defined inside this file:
- An OSD cluster is created and the addon, which is being tested, is installed. Openshift API is used to perform these operations via the API definition provided at https://api.openshift.com
- The e2e prow job definition, specifically for the addon from this file, is parsed and hence, the parameters required to run its e2e tests will be recognized as well.
- The “testHarness” image for the addon is parsed and executed against the parameters fetched from the above step.
- If an MT-SRE team member notices those tests failing, they should notify the respective team to take a look at them and fix them.
5.3 - Top Level Operator
5.3.1 - Customer Notifications
Status Page
https://gitlab.cee.redhat.com/service/app-interface/-/blob/master/docs/app-sre/statuspage.md
https://service.pages.redhat.com/dev-guidelines/docs/appsre/advanced/statuspage/
Service Logs
Internal Email
There are multiple ways a user or group can get notified of service events (e.g. planned maintenance, outages). There are two fields in the addon metadata file (see Add-On metadata file schema documentation for more information) where email addresses can be provided:
addonOwner: REQUIRED Point of contact for communications from Service Delivery to addon owners. Where possible, this should be a development team mailing list (rather than an individual developer).addonNotifications: This is a list of additional email addresses of employees who would like to receive notifications about a service.
There is also a mailing list that receives notifications for all services managed by Service Delivery. Subscribe to the sd-notifications mailing list here.
5.3.2 - Dependencies
This document describes the supported implementation for Addon dependencies, as signed-off by the Managed Tenants SRE Team.
Dependencies Specification
- Addons must specify dependencies using the OLM dependencies feature, documented here
- The dependencies must have the version pin-pointed. Ranges are not allowed.
- The dependencies must come from a Trusted Catalog. See the Trusted Catalogs section for details.
Trusted Catalogs
The Addon and its dependencies must come from Trusted Catalogs. Trusted Catalogs are those with content published by the Managed Services Pipelines, implemented by CPaaS, or by the Managed Tenants SRE Team.
Trusted Catalogs List
- Addon catalog: the catalog created by the Managed Tenants SRE Team, for the purpose of releasing the Addon. Dependency bundles can be shipped in the same catalog of the Addon. The Addon catalog is considered “trusted” for the dependencies it carries.
- Red Hat Operators catalog: the catalog content goes through the Managed Services Pipelines, same process to build some Addons themselves, just with a different release process. This catalog is considered “trusted” and can be used for dependencies.
Including a Catalog in the Trusted List
- Make sure that the catalog is available on OSD and its content is released through the Managed Services Pipelines, implemented by CPaaS.
- Create a Jira ticket in the MT-SRE Team backlog, requesting the assessment of the OSD catalog you want to consider as “trusted”.
Issues
There’s a feature request to the OLM Team to allow specifying the CatalogSource used for the dependencies:
5.3.3 - Environments
Mandatory environments
Add-ons are normally deployed to two environments:
ocm stage: development/testing - All add-ons must deploy to this environment before being released to production.ocm production: once the deployment in stage has been reviewed, accepted, and approved it can be promoted to production via/lgtmby your SRE team.
We recommend the ocm stage and ocm production add-on metadata be as
similar as possible.
SLOs
ocm stage have no SLO and operates with best effort support from Add-on SRE,
SREP, and App-SRE
osd stage cluster have no SLO and operates with best effort support from Add-on
SRE, SREP, and App-SRE
ocm production environments are subject to App-SRE SLOs.
osd production cluster environments are subject OSD SLOs.
Additional Environments (via duplicate add-ons)
Some add-on providers have had use cases which require additional add-on envs.
While we only have ocm stage and ocm prod, managed-tenants may be leveraged
to deploy to an additional add-on (like edge or internal). Today we don’t recommend
this practice due to the need to clone all add-on metadata which increases the
risk for incorrect metadata going to production/customer clusters.
If you need to do the above, please reach out to your assigned SRE team for guidance first.
5.3.4 - Plug and Play Addon
Package Operator
Package Operator is a Kubernetes Operator for packaging and managing a collection of arbitrary Kubernetes objects.
Each addon with a packageOperator defined in its spec will have a corresponding
ClusterObjectTemplate.
The ClusterObjectTemplate is an API defined in Package
Operator, enabling users to create an object by templating a
manifest and injecting values retrieved from other arbitrary source objects.
However, regular users typically do not need to interact with the ClusterObjectTemplate.
Instead, they can interact with the generated
ClusterPackage
manifest.
Example of a ClusterPackage manifest:
apiVersion: package-operator.run/v1alpha1
kind: ClusterPackage
metadata:
  name: <addon_name>
spec:
  image: <addon.spec.packageOperator>
   config:
    addonsv1:
      clusterID: a440b136-b2d6-406b-a884-fca2d62cd170
      deadMansSnitchUrl: https://example.com/test-snitch-url
      ocmClusterID: abc123
      ocmClusterName: asdf
      pagerDutyKey: 1234567890ABCDEF
      parameters:
        foo1: bar
        foo2: baz
      targetNamespace: pko-test-ns-00-req-apy-dsy-pdy
The
deadMansSnitchUrlandpagerDutyKeyare obtained from the ConfigMaps using their default names and locations. IMPORTANT: To successfully inject thedeadMansSnitchUrlandpagerDutyKeyvalues into theClusterPackagemanifest, you must keep the default naming scheme and location of the corresponding ConfigMaps. See the addons deadMansSnitch and addons pagerDuty documentation for more information.Additionally, all the values present in
.spec.config.addonsv1can be injected into the objects within your packageImage. See the package operator documentation for more information.
Tenants Onboarding Steps
Although you can generate the packageImage yourself using the package operator documentation, we recommend you use the Managed Tenants Bundles (MTB) facilities.
The following steps are an example of generating the packageImage for the reference-addon package using the MTB flow:
In the MTB repository, create a
packagedirectory and add themanifests.yamlinside thepackagedirectory. See the following merge request for an example.The MTB CI creates the packageImage and the Operator Lifecycle Manager (OLM) Index Image as part of the team’s addon folder.
The MTB CI creates a merge request to the managed-tenants repository and adds a new AddonImageSet with the PackageImage and OLM Index images.
5.4 - managed-tenants Repository
Addons are deployed through GitOps pipelines. Most of the configuration for Addons can be found in the managed-tenants Repository . See the create an addon documentation page for a good starting point.
5.5 - SKU
NOTE MT-SRE do not influence SKU creation/priorities. You must work with OCM directly for this.
Requesting a SKU
To request a SKU, please complete the following steps:
- Determine a unique quota ID for the addon. This should be
lowercase with dashes and of the format
addon-<addon-name>. For example:addon-prow-operator - Create a JIRA Request at Openshift Cluster Manager
with the subject
Request for new Add-On SKU in OCMand the following information:- Add-On name.
- Add-On owner.
- Requested Add-On unique quota ID.
- Additional information that would help qualify the ask, including goals, timelines, etc., you might have in mind.
- You will need at least your PM and the OCM PM’s to sign off before the SKU is created. We expect to resolve these requests within 7 working days.
Requesting SKU Attributes Changes
From time to time you may want to update some SKU fields like supported cloud providers, quota cost, product support, etc. To do this:
- Create a JIRA Request at Openshift Cluster Manager
- Ping the ticket in #service-development-b Slack channel (@sd-b-team is the handle)
- This requires an update to be committed in-code in AMS, then deployed to stage and eventually prod (allow up to 7 working days).
Current Status
To check current SKUs and attributes, see OCM Resource Cost Mappings.